Win Over More Brands with InstaAnalytics

Powered by Llama

Get approved faster with a deep, yet easy-to-read analysis of your Instagram audience and reputation. We show over a dozen key metrics that brands look for the most.

Signup for Free
InstaAnalytics Home Screen featuring Leo the LTV Llama
Bezier Curve

Get Started in Minutes

Llama Signup Form
1

Sign Up with Llama

InstaAnalytics exists within Llama, a free platform that lets brands continuously reward you for increasing their customer loyalty. Simply sign up with Llama, connect your Instagram, and start applying to some brand offers on the network.

Connect Your Instagram account to see your personal InstaAnalytics report
2

Connect Your Instagram

We’ll display your InstaAnalytics report on your ambassador profile to help brands determine if you’ll be a good fit.

In-Depth Audience Analysis

Your InstaAnalytics report starts with a thorough rundown of your audience, including things like quality, demographics, and authenticity.

2

Audience Region

The top five countries, U.S. states (if applicable), and cities your audience is located in.

2
4

Audience Demographics

A breakdown of your audience’s age, gender, ethnicity, and primary language.

4
1
1

Audience Quality Score

An overall rating of your audience that combines quality, engagement rate, and authenticity.

3
3

Audience Type

How much of your audience consists of real people, other influencers, mass followers, and suspicious accounts.

InstaAnalytics Quality Score breakdown

Audience Quality Score

An overall rating of your audience that combines quality, engagement rate, and authenticity.

Graph of Audience breakdown by specific region

Audience Region

The top five countries, U.S. states (if applicable), and cities your audience is located in.

Pie Chart of audience type by real people, influencers, mass followers and suspicious accounts

Audience Type

How much of your audience consists of real people, other influencers, mass followers, and suspicious accounts.

Bar graph of audience demographics separated by age & gender, ethnicity and language

Audience Demographics

A breakdown of your audience’s age, gender, ethnicity, and primary language.

Pie Chart breaking down the percent of audience that is considered reachable

Your True Reach

While a follower count can give brands a general idea of your reach, an assessment of those followers can give them a much better idea. For example, if you have 2,000 followers and half of them follow thousands of other accounts, you’re really only reaching 1,000 people. We keep this in mind when generating your InstaAnalytics report and show a percentage of your true reach and how it compares to similar accounts.

Crush the Competition

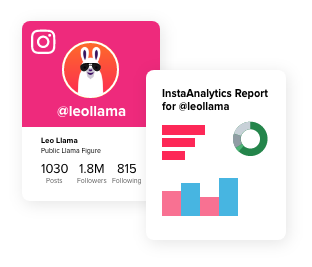
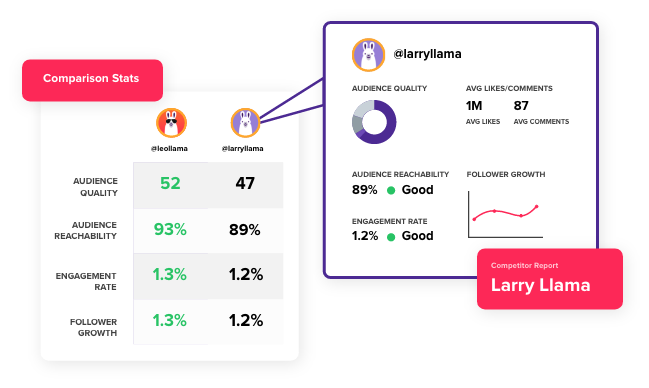
To help you keep an eye on your competition and let brands know how you rank, your InstaAnalytics report also features a comparison of your stats versus those of similar accounts. If your numbers look good against those accounts, it could increase your chances of getting approved by a brand.

Want to feature more than one of your Instagram accounts on your profile? No prob-llama. Once you’ve connected your primary account, we’ll give you the option to connect all of your other accounts, too*.

*Each additional connected account will cost extra. See pricing below.
Demontration of analyzing a competitor's InstaAnalytics report and comparing the main data points

Engagement Breakdown

Your InstaAnalytics report also breaks down a few data points related to engagement. This helps assure brands that the interactions between you and your audience are authentic.

Graph comparing average likes and average comments
Average Likes & Comments Icon

Average Likes and Comments

Average likes and comments on your Instagram account.

Bar graph of InstaAnalytics engagement rate data
Engagement Rate Icon

Engagement Rate

Percent of audience who like or comment the posts (engage with the content).

Comparing amount of likes between two Instagram posts
Likes Spread Icon

Likes Spread

Difference in number of likes between posts. If the spread is too low it might indicate that blogger have paid for artificial likes.

Scatterplot demonstrating Likes-Comments ratio
Likes-Comments Ratio Icon

Likes-Comments Ratio

Likes-Comments Ratio shows if the blogger gets more likes or more comments.

Try InstaAnalytics Risk-Free

InstaAnalytics is free to try for 30 days. We won’t even ask for a credit card up front. If you like it, you can keep your report up-to-date by opting in to an affordable monthly plan or save even more with an annual subscription. Stacked up with everything else Llama has to offer, it’s worth considering.

InstaAnalytics

Monthly Subscription

Keep your InstaAnalytics fresh and up-to-date with monthly reports so brands can fairly asses your stats.

$0.99 / month

per account

30-Day Risk-Free Trial

InstaAnalytics

Annual Subscription

Get guaranteed monthly updates to your InstaAnalytics report for a whole year and save 40% when you choose our annual subscription.

Save 40%

$7.20 / year

per account

30-Day Risk-Free Trial

Ready to prove to brands you’ve got what it takes to drive customers on Instagram?

Give brands more insight into your Instagram following with up-to-date audience demographics, engagement, and performance from InstaAnalytics.

Signup for Free